Last week, I asked readers to submit an integer between 0 and 100, and the number they submitted was to represent their best guess at what they thought would be 2/3 of the average of all numbers submitted. (If you missed it, read the question before continuing here.)
Today at 10:15am EST, I collected the results. Here’s what I found:
There were a total of 5,101 reader guesses.
Here’s how many came in each day:
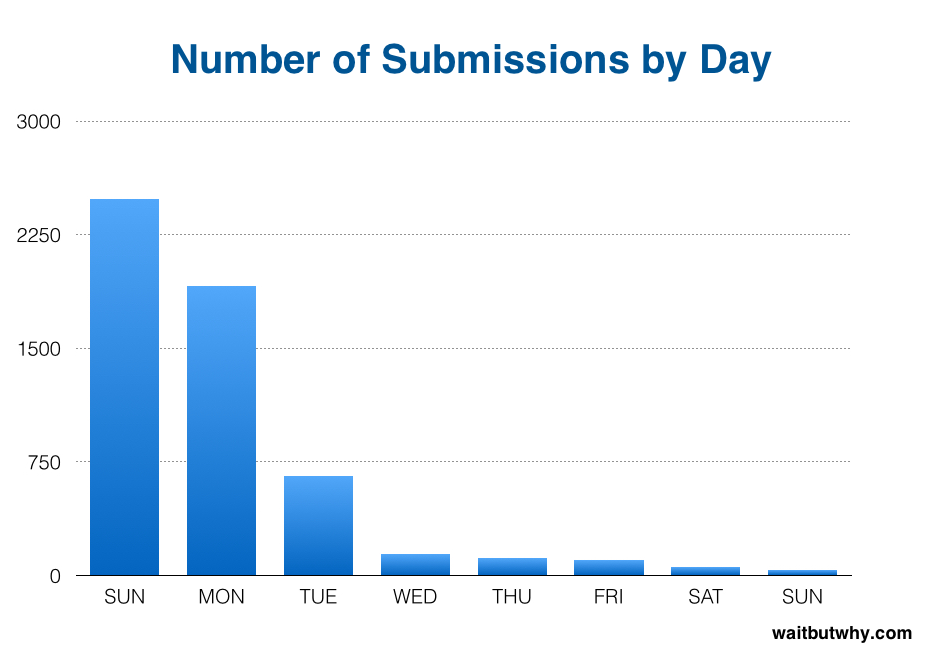
Not all of the 5,101 submissions were legitimate:
44 submissions were blank.
29 had decimals and weren’t integers.
4 submissions were negative numbers. The lowest was -1.0 x 10133. Someone got cute.
48 submissions were higher than 100. The highest was a string of 13,670 nines. Which rounds to 1.0 x 1013,670. This can be simplified to about 101002.067, a number far bigger than a googol. But it’s much, much less than Graham’s Number. It’s falls between 333 and 3333. Thank you for following instructions.
14 submissions were kind of numbers but not really. Things like “2/3 of 30″ and “24,66” and writing out every number from 1 to 100, like “1 2 3 4 5 ……. 99 100.” Nice job.
22 submissions were words, not numbers. Two sounded like an eighth grader saying the dirtiest words he knows, one was a post topic suggestion, and one was this: “Yeah, thanks mum. I’ll just let you know when I’m 5min away” followed by this a few seconds later: “Oops! Sorry! Accidentally typed in the work box! Meant to send that to my mother.”
After eliminating all of those, we were left with 4,940 legitimate submissions.
The people making a legitimate guess had to think hard about what everyone else would do. Or, they had to think hard about what everyone else would think everyone else would do. Or actually, they had to think hard about what everyone else would think everyone else would think everyone else would do.
This kind of head-exploding thought process can go on and on.
One way to approach it is like this—everyone is trying to “undercut” the rest of the group, picking 2/3 of what other people are guessing. But everyone is thinking like that, so the game is actually to undercut everyone else’s attempt to undercut—in other words, you need to pick 2/3 of 2/3 of what everyone else thinks the mean is. But if everyone is thinking that, you’ll lose with that logic. You need to be a further step ahead, picking 2/3 of 2/3 of 2/3 of what everyone else thinks everyone else thinks the mean is. And so on.
If you continue with this logic, you either end up at 0 or 1. You end up at 0 if you just multiply 2/3 by itself a bunch of times. But if you think of it in distinct steps, you realize that if the mean got down to 1, 2/3 of 1 is .666… which rounds to 1, so the mean and 2/3 of the mean are the same and the game stops there, making the right answer 1.
But that logic assumes that almost everyone is A) really smart, B) taking the game dead seriously, and C) is spending a decent amount of time thinking about their answer. So as clever as it is to answer 0 or 1, it’s actually more clever to guess something higher—something that takes into account the whole pool. To do that you have to ask, “Who are the people who read the Wait But Why Dinner Table and how will they treat this exercise?” The question isn’t about what perfect logic says to do if everyone in the game is using perfect logic—it’s about what thousands of Wait But Why readers will end up doing.
And here’s what they did:
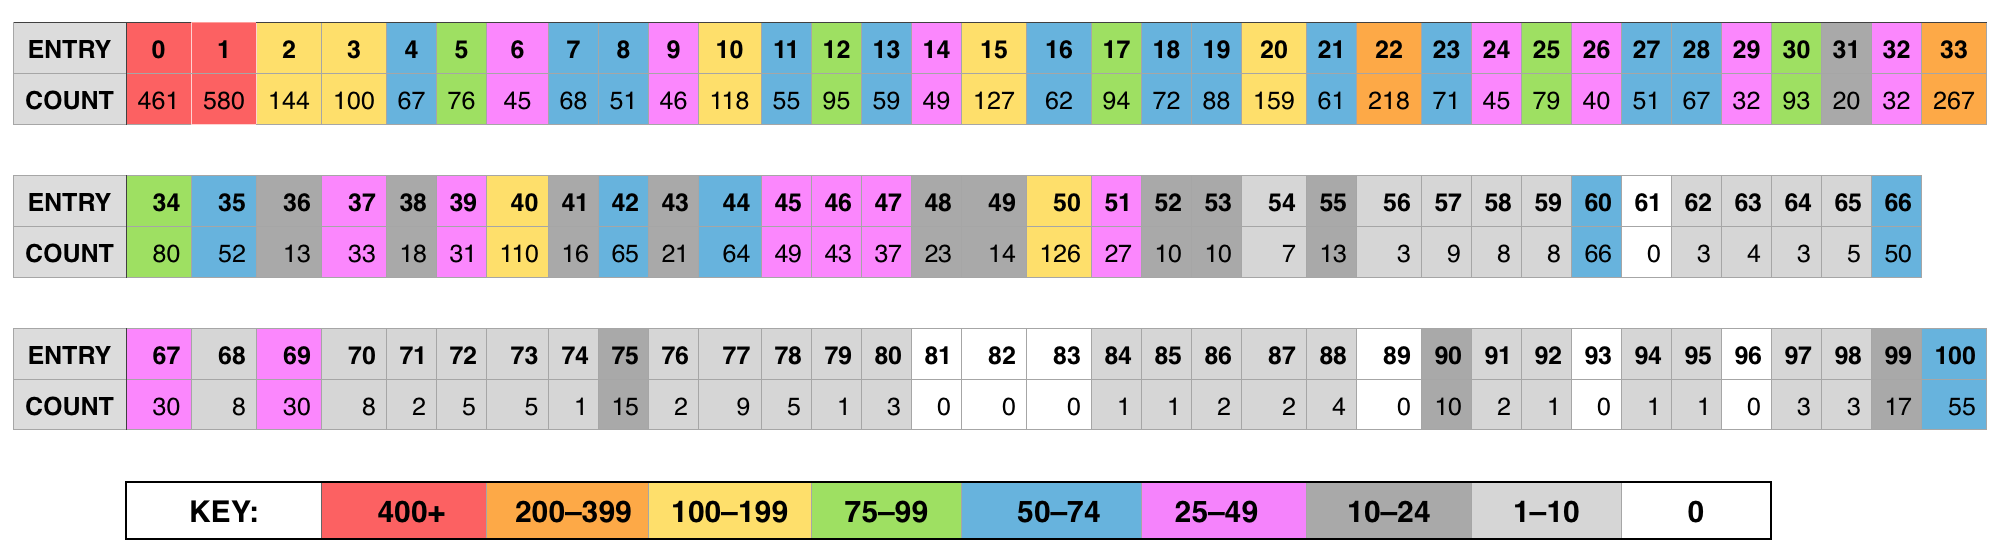
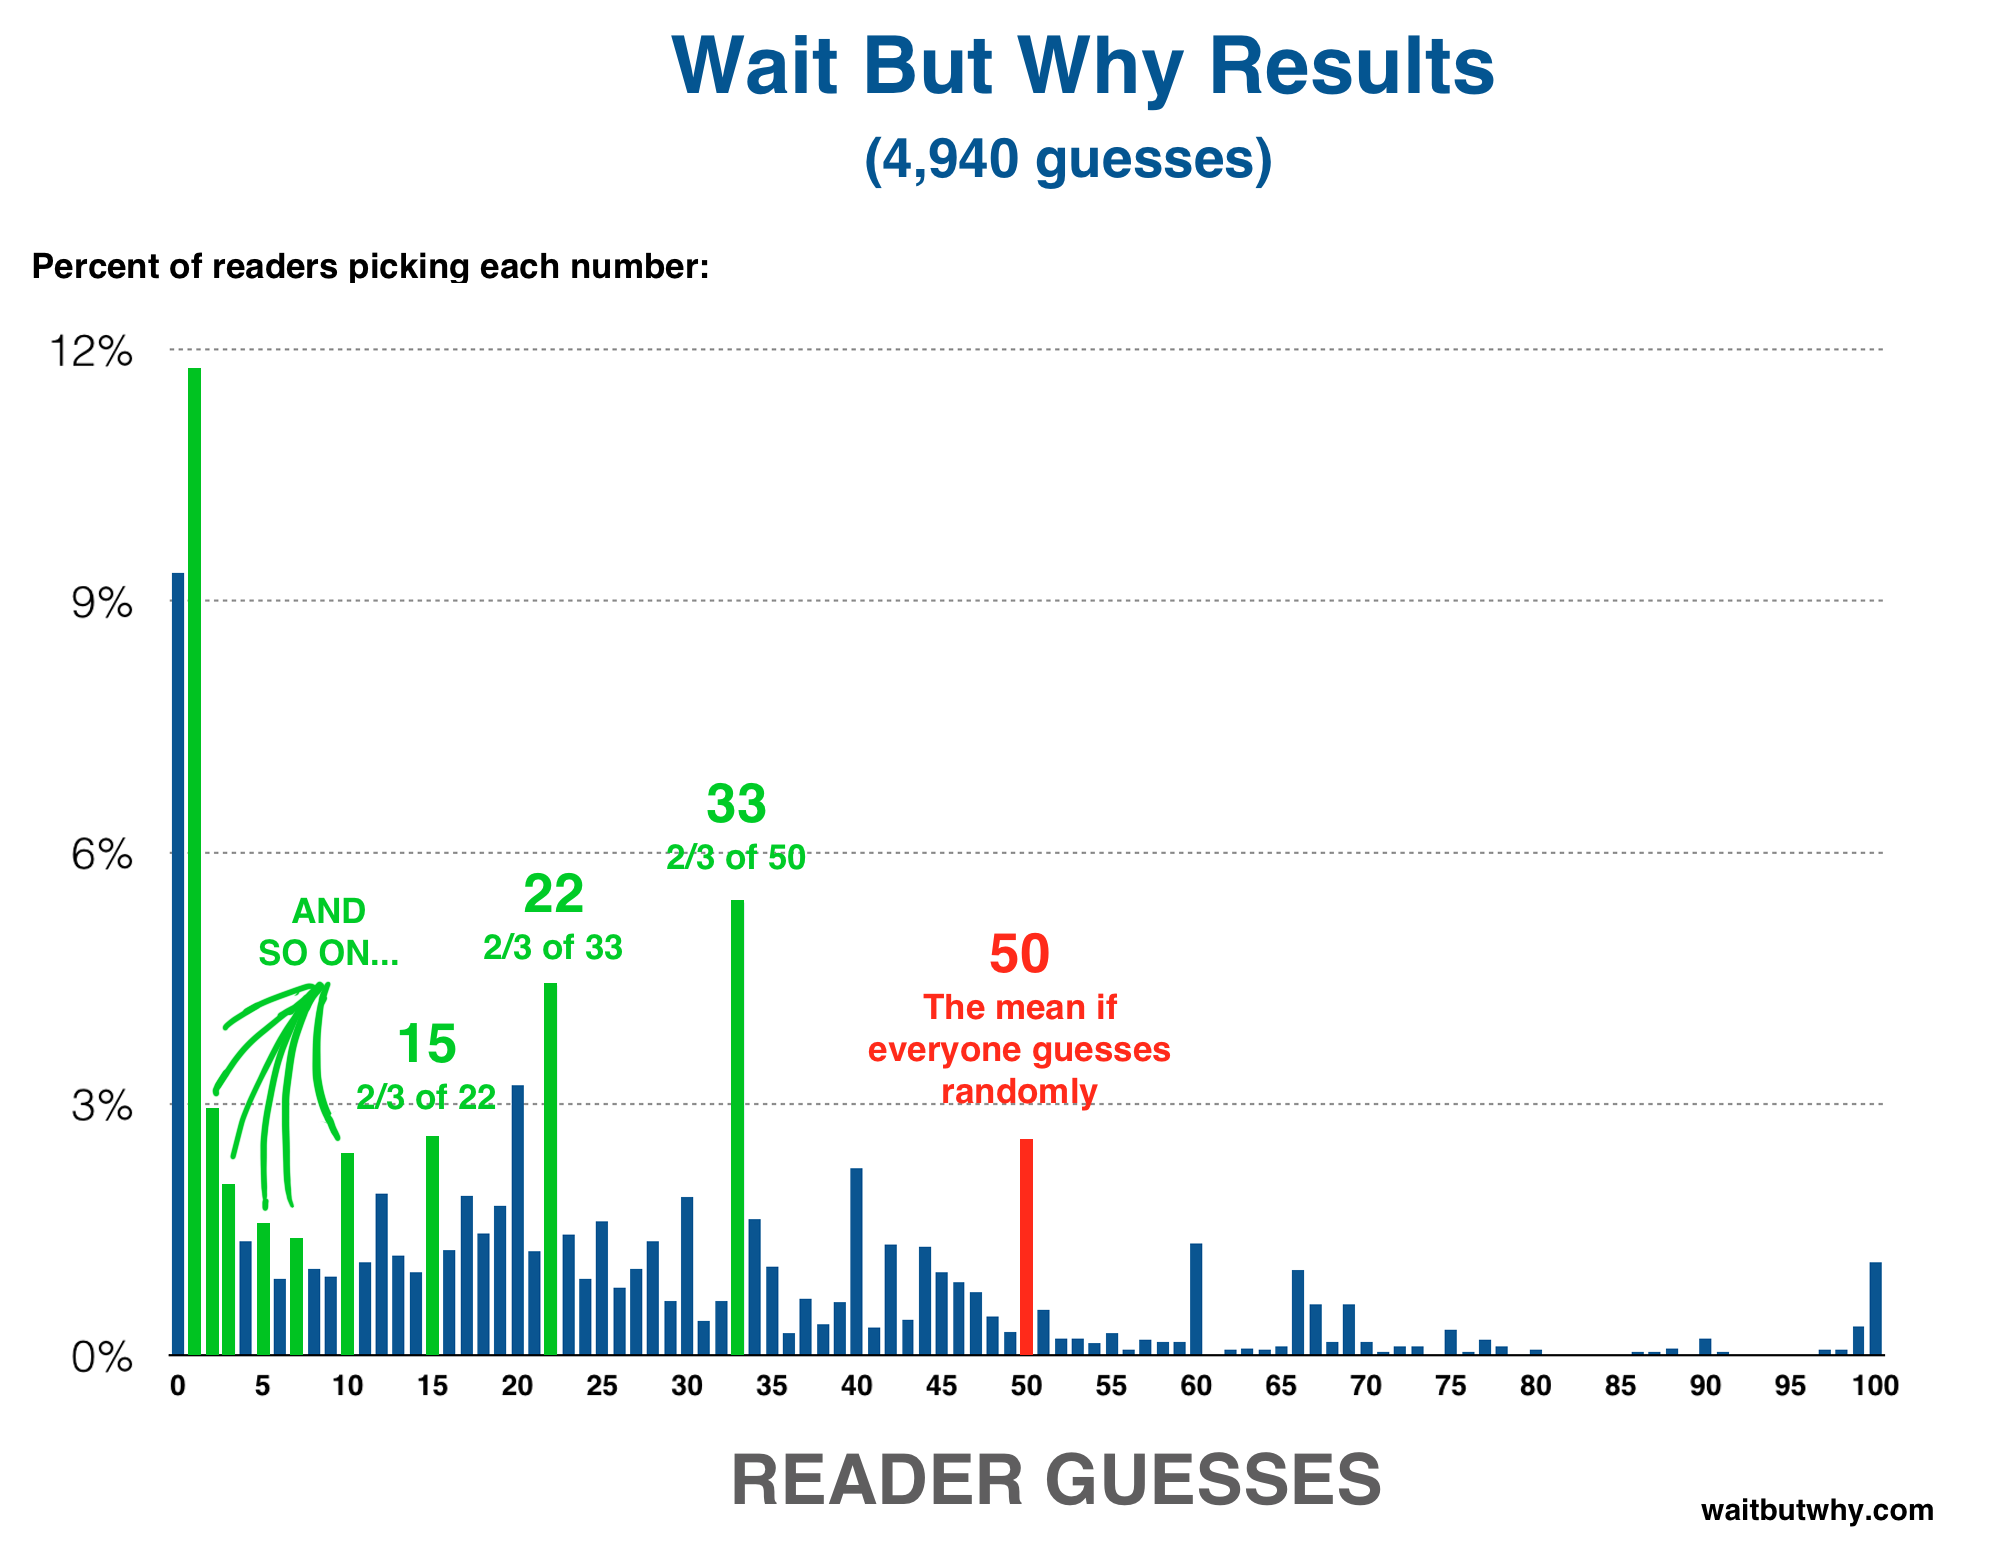
Here are those results on a graph, showing the percentage of the whole pool that guessed each number:
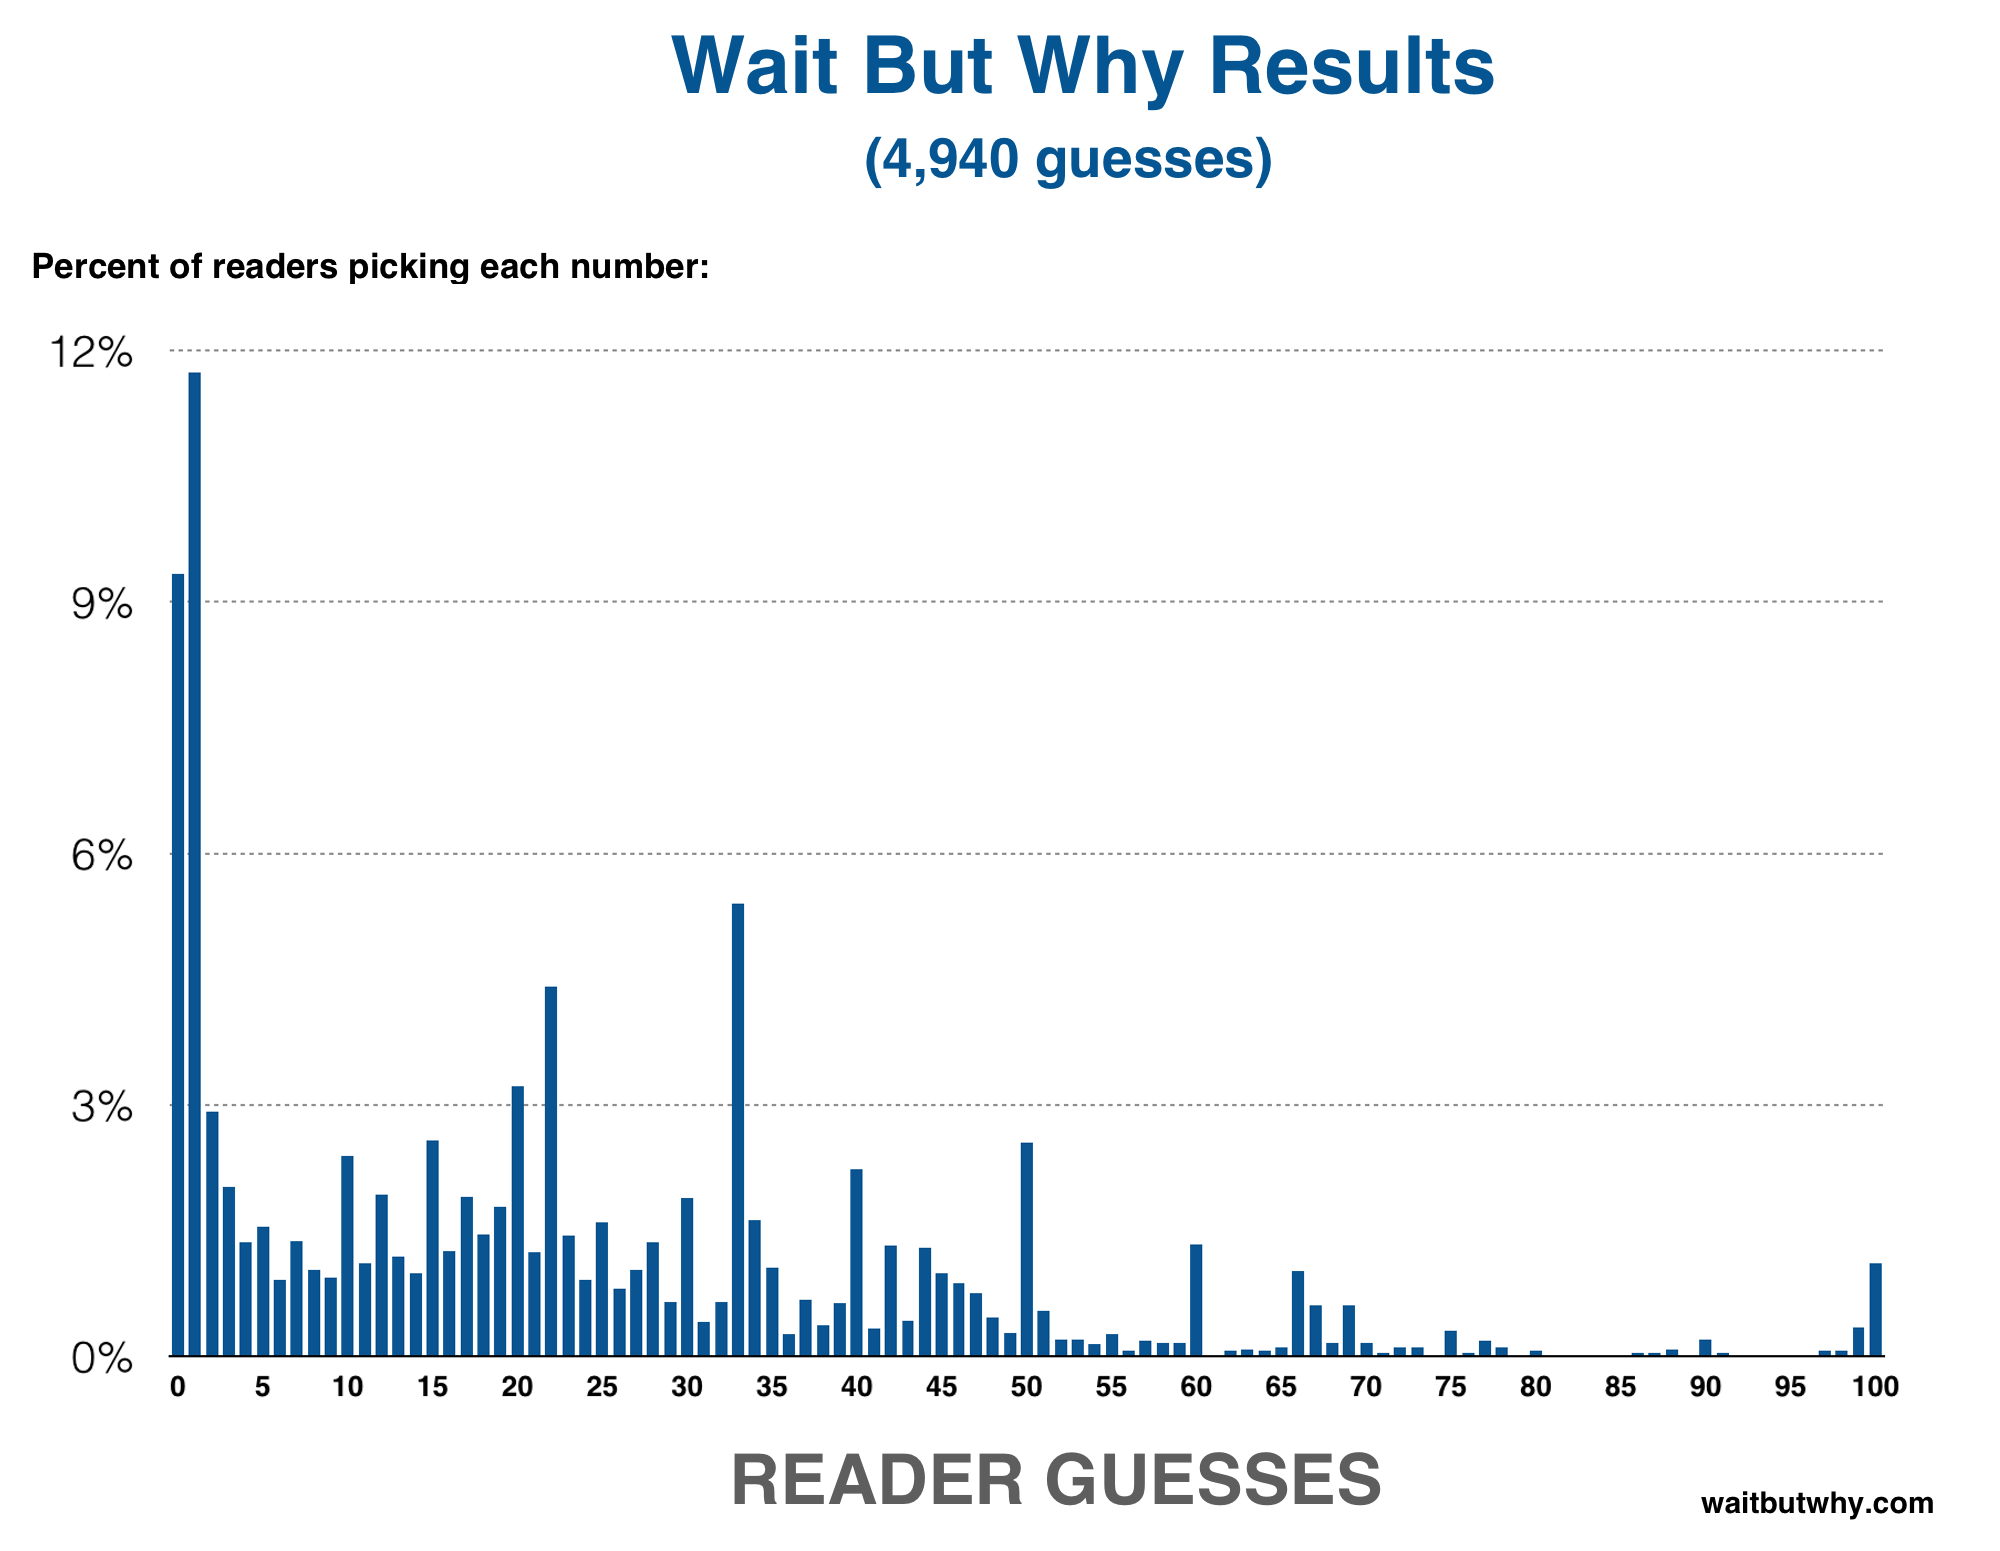
Let’s discuss what we see here. There’s the clear high number of 0 and 1 guesses. But what else is happening?
There are some obvious things you’d expect to happen when you have a large number of people submitting a number, regardless of what the question asks readers to do—like the multiples of 10 being represented well:
Also, as expected, there were many more lower answer than higher ones. This is because of the simple logic that the highest the mean could possibly be is 100, and 2/3 of 100 rounds to 67, so all answers 68 or higher have no chance of being the winner. And if you assume that other people are thinking about that, you assume that the mean will likely be well below the highest possible correct answer (67), so 2/3 of the mean will likely be below 50. Again, this logic continues and favors lower answers.
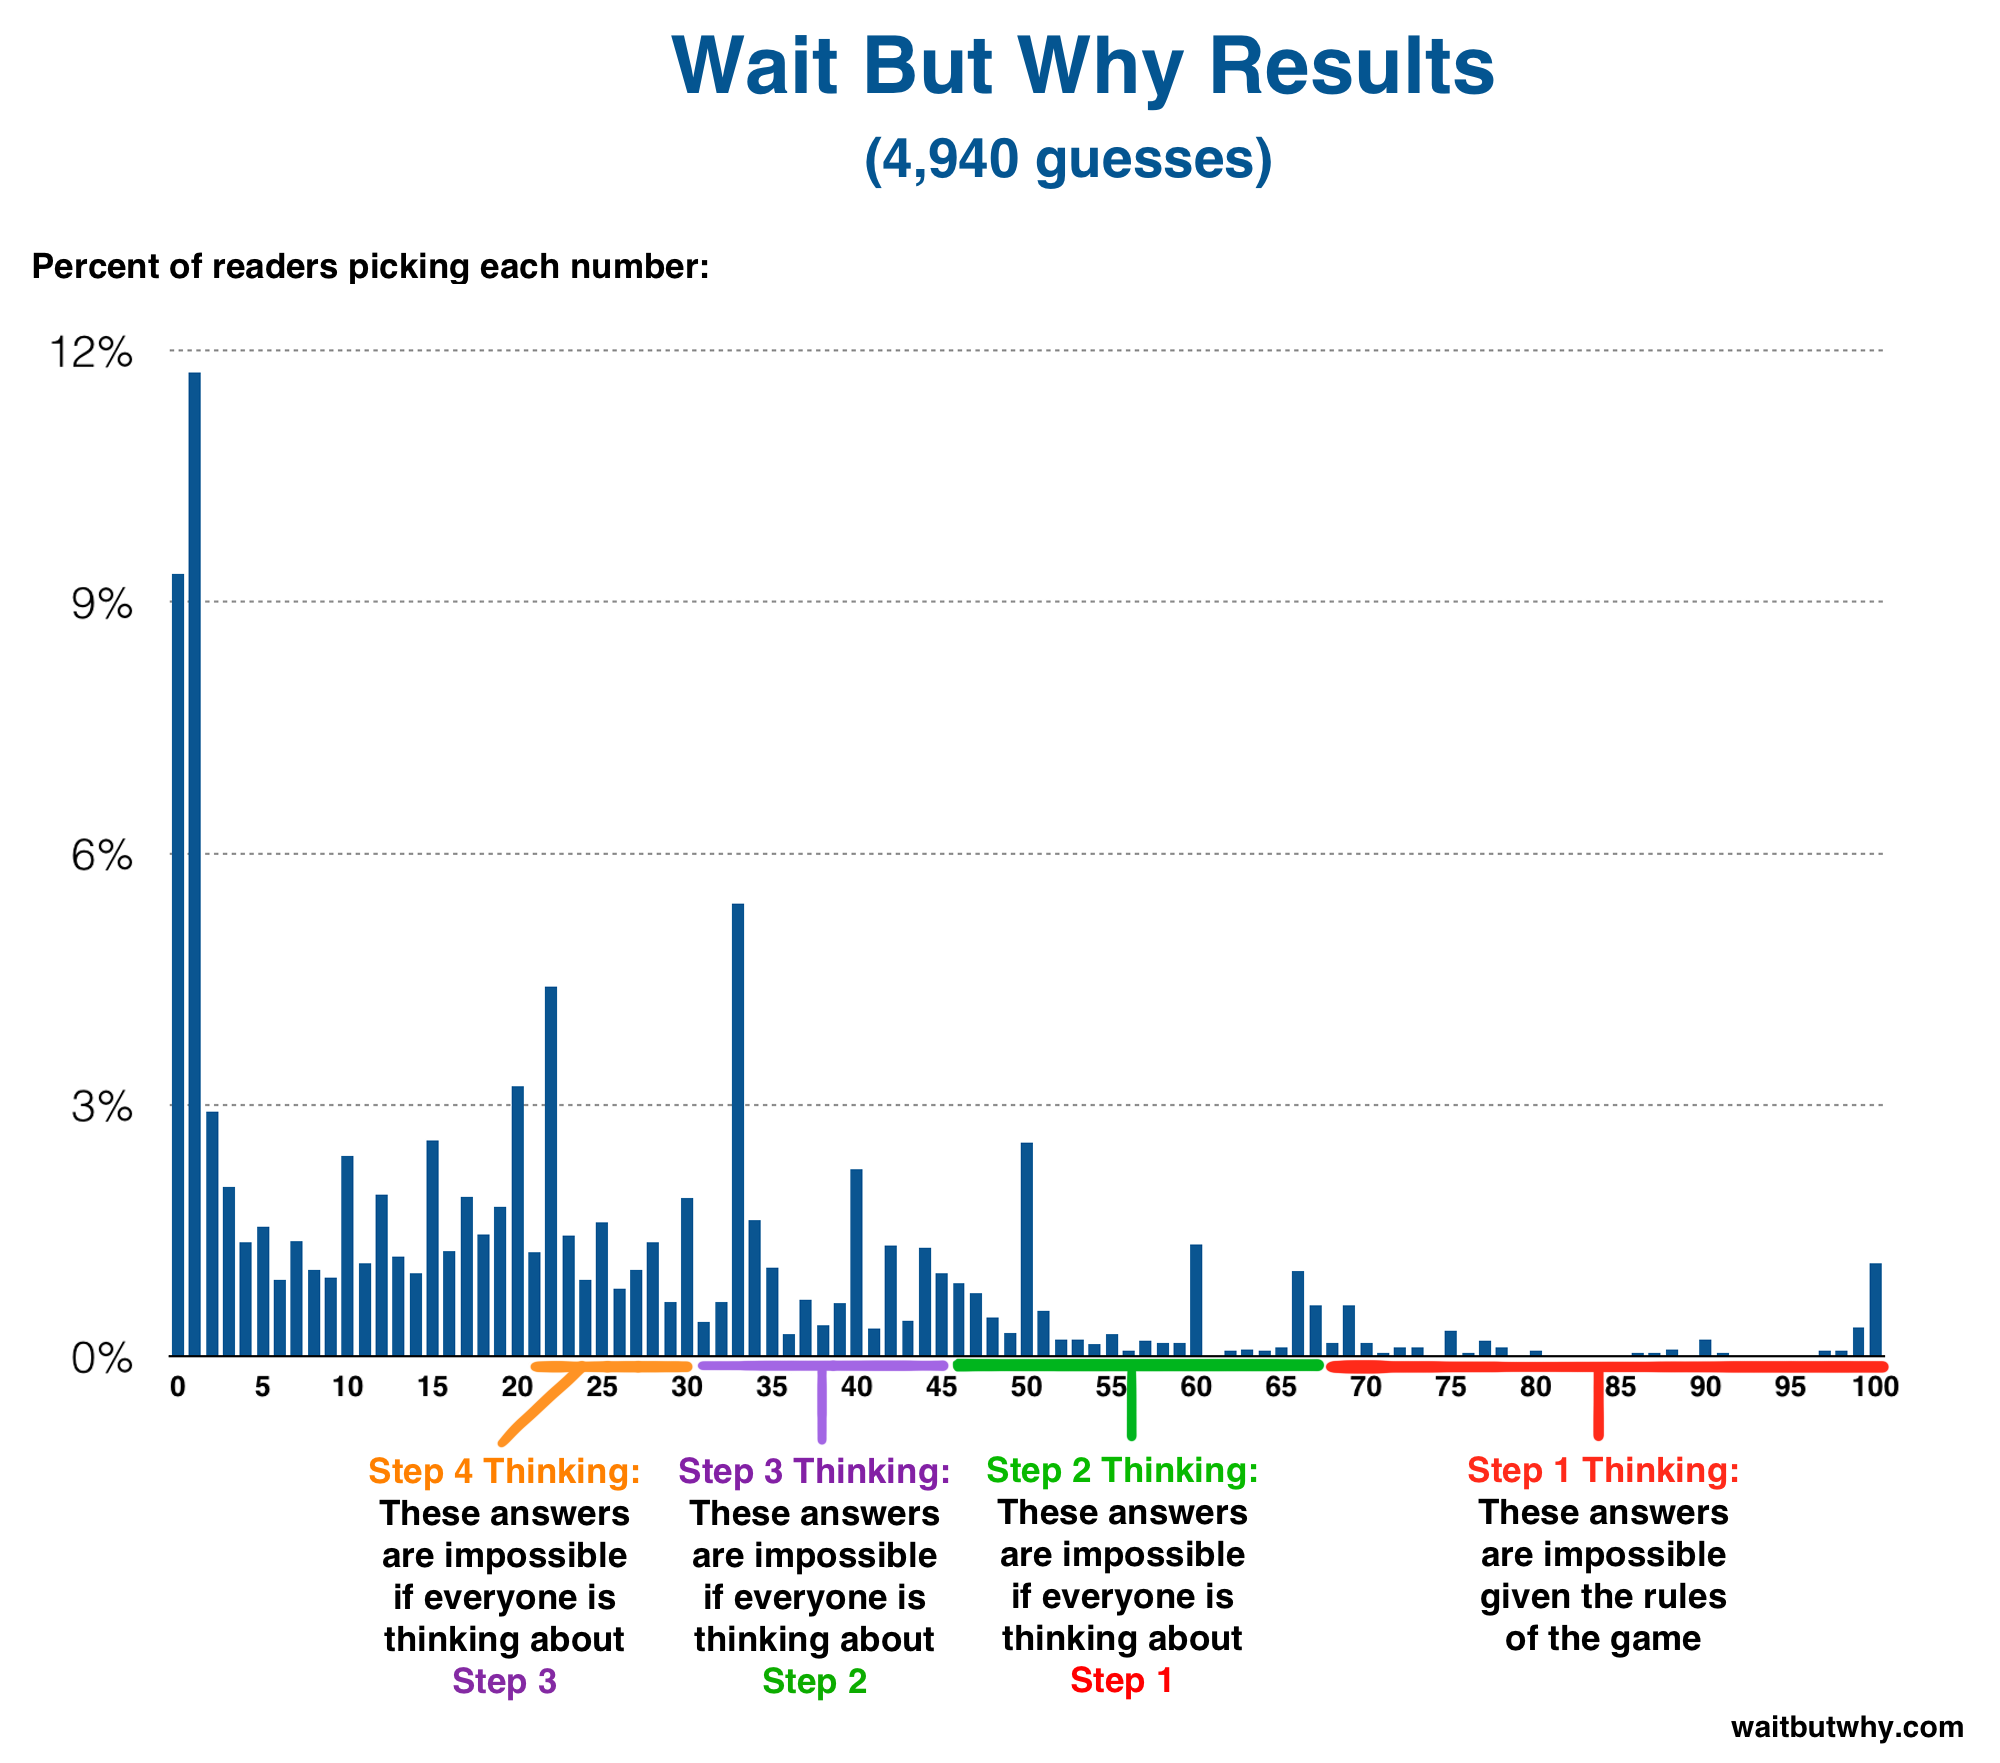
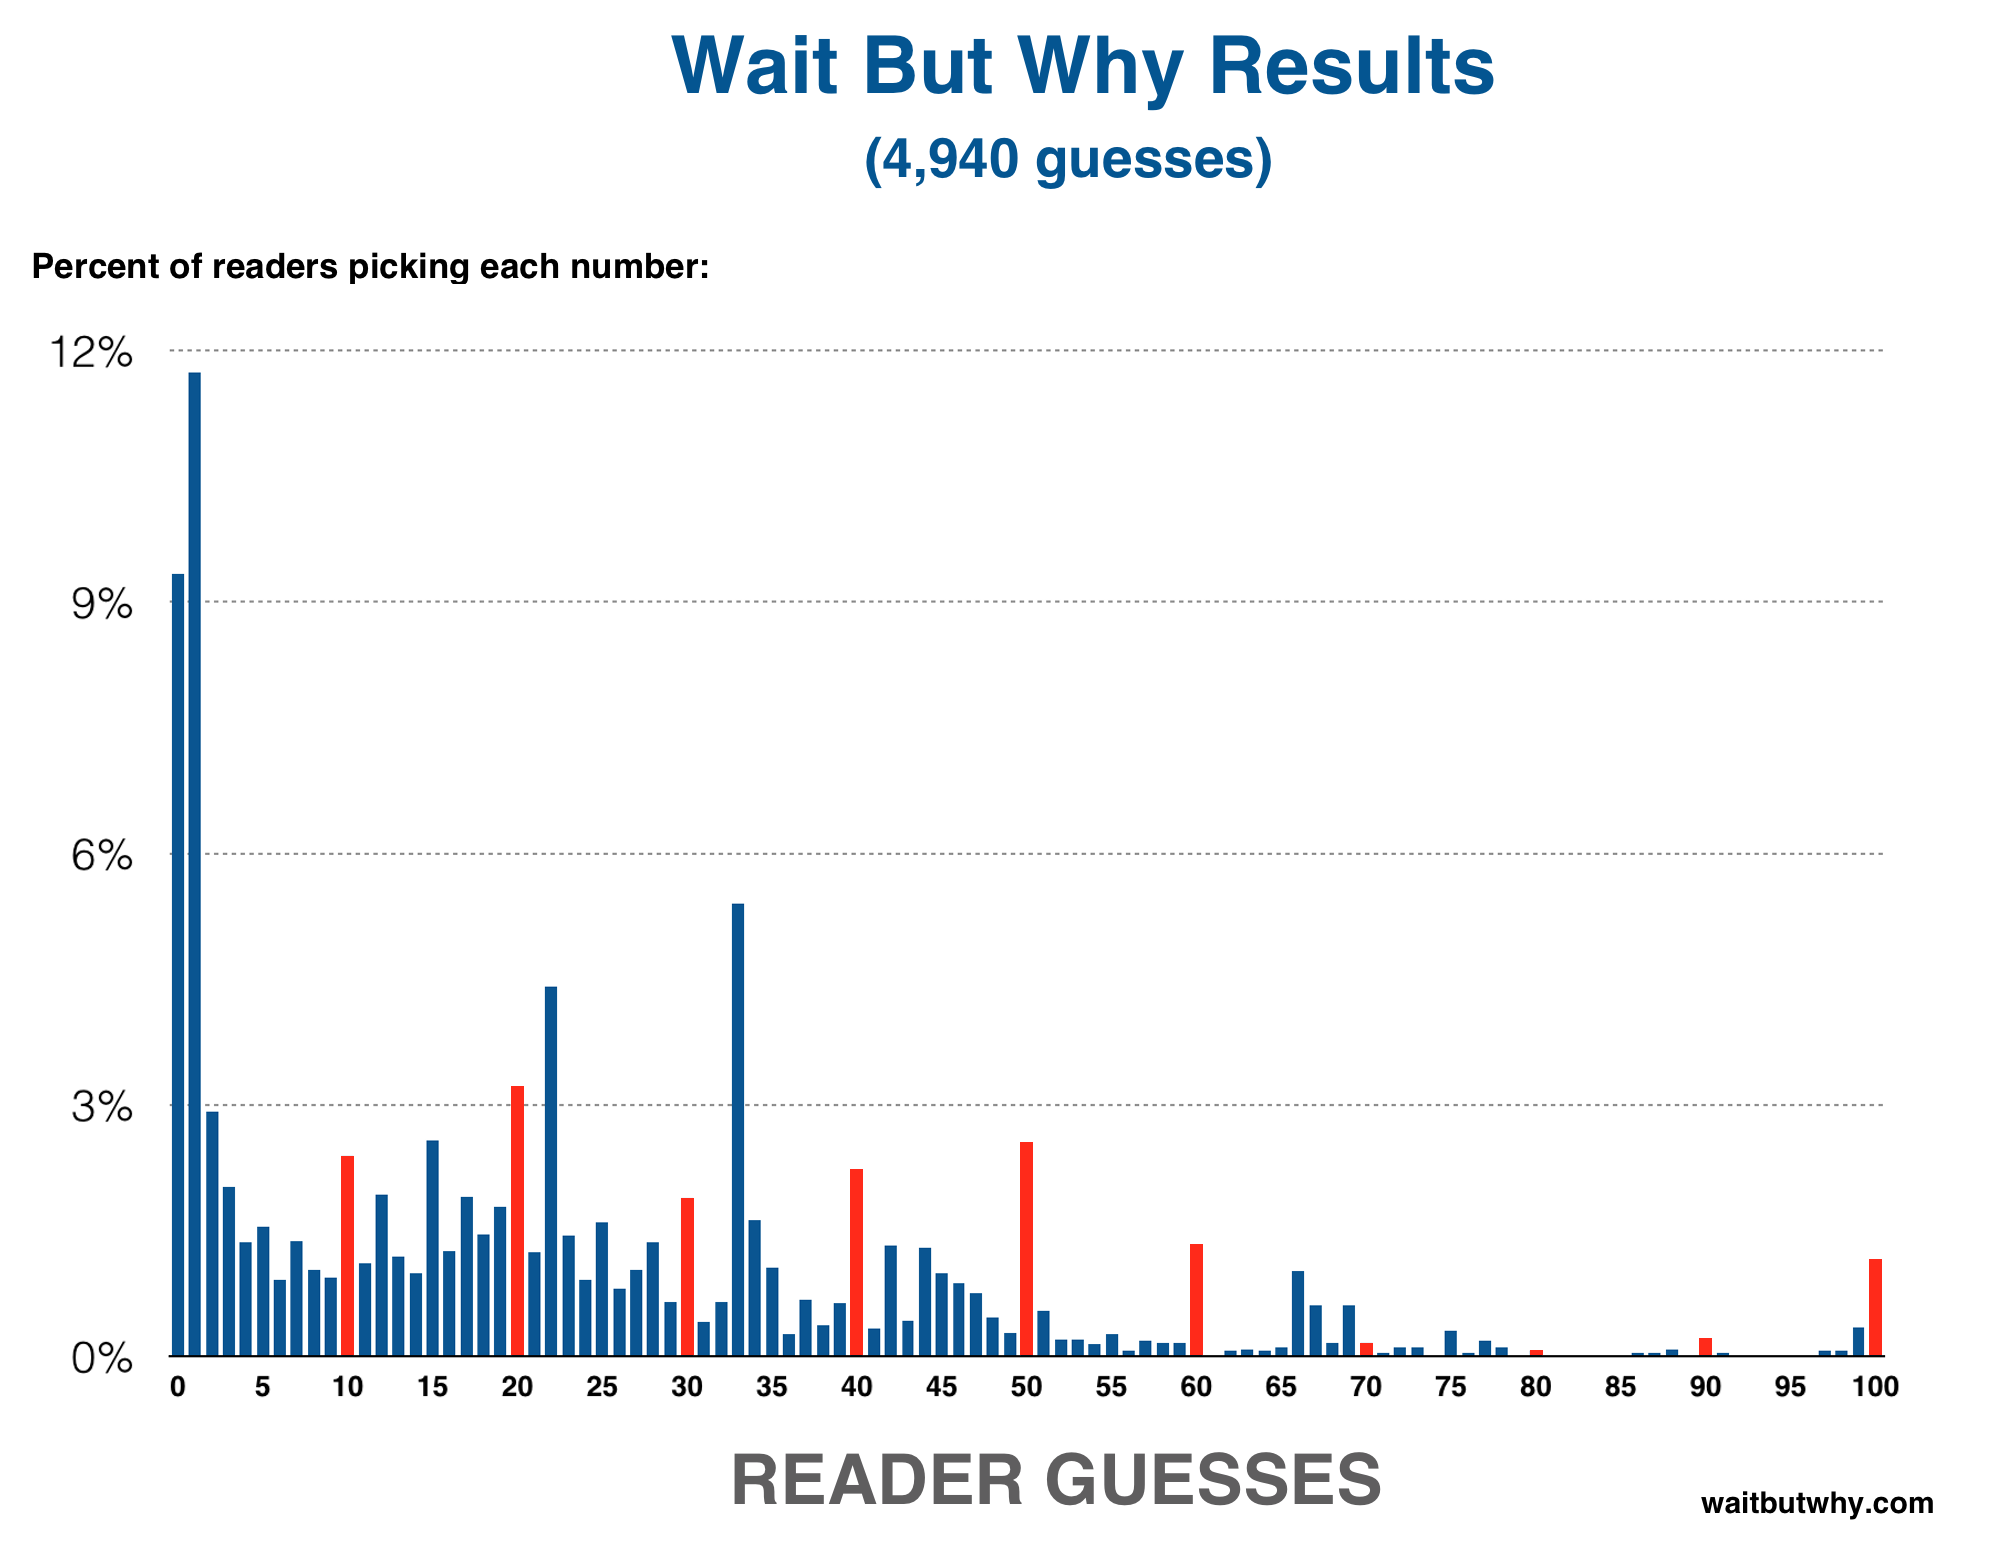
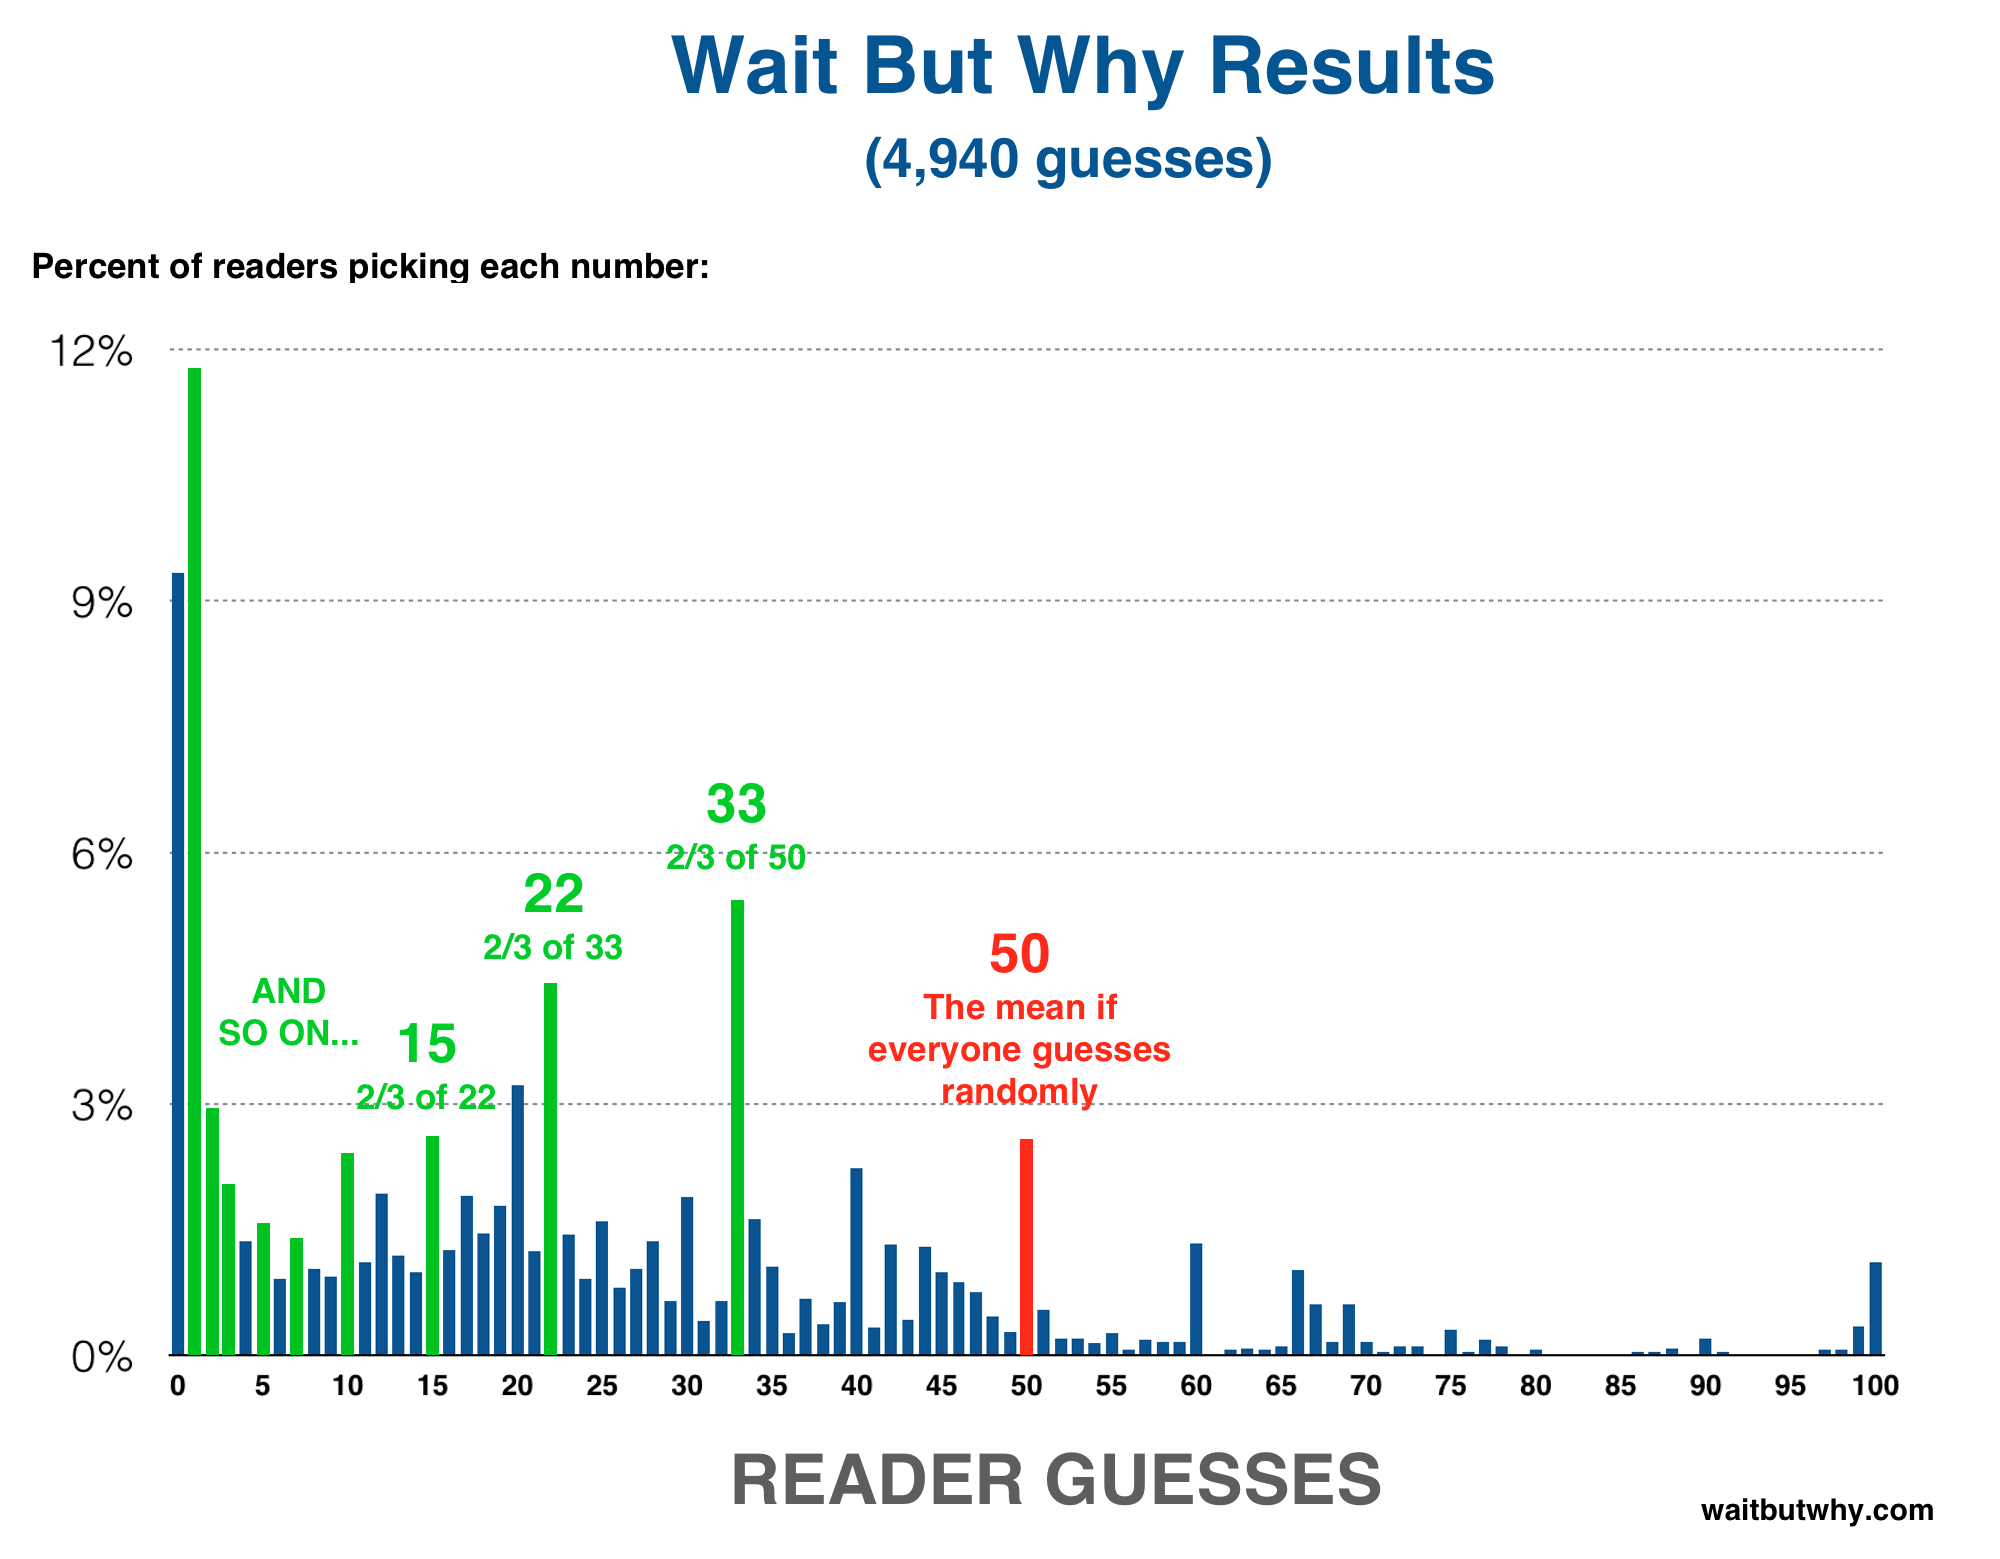
You can also see a common line of thinking take shape in the results. That line starts and says, “If everyone guessed randomly, the mean would be 50 and the correct answer would be 2/3 of 50, which rounds to 33.” Some people stop right there, which is why 33 is the third most common answer. Others say, “33 will be a super common answer because it’s 2/3 of 50, so I’ll pick 2/3 of 33″—which is why 22 is the fourth most common answer. Still others will go a step further and pin the rest of the crowd on the 22 logic, so they’ll answer 15. And so on.
The steps in this line of logic go 50 > 33 > 22 > 15 > 10 > 7 > 5 > 3 > 2 > 1. And you can see that happening here:
Someone choosing 33 tells me that they either didn’t think hard enough about this or they’re not a great game-player or both.
Someone choosing 1 tells me that A) they’re clever enough and spent enough time to figure out the logic for picking 1, but that either B) that they didn’t think hard enough about this to realize that the mean will end up being much higher, or C) they think that almost all Wait But Why readers are similar to them.
Someone choosing 10 or 15 or 22 or another answer in that area tells me that either A) they’re not thinking about this as hard as the people who chose 1 and they didn’t consider how the succession of their logic can continue past where they went, or B) they’re very clever and they thought about all the people who would choose 0 and 1, they thought about all the people who would choose 33, they thought about the inevitable goofballs picking numbers above 50, and they estimated the mean from that information before submitting 2/3 of that estimation as their answer.
And it’s those people who nailed it:
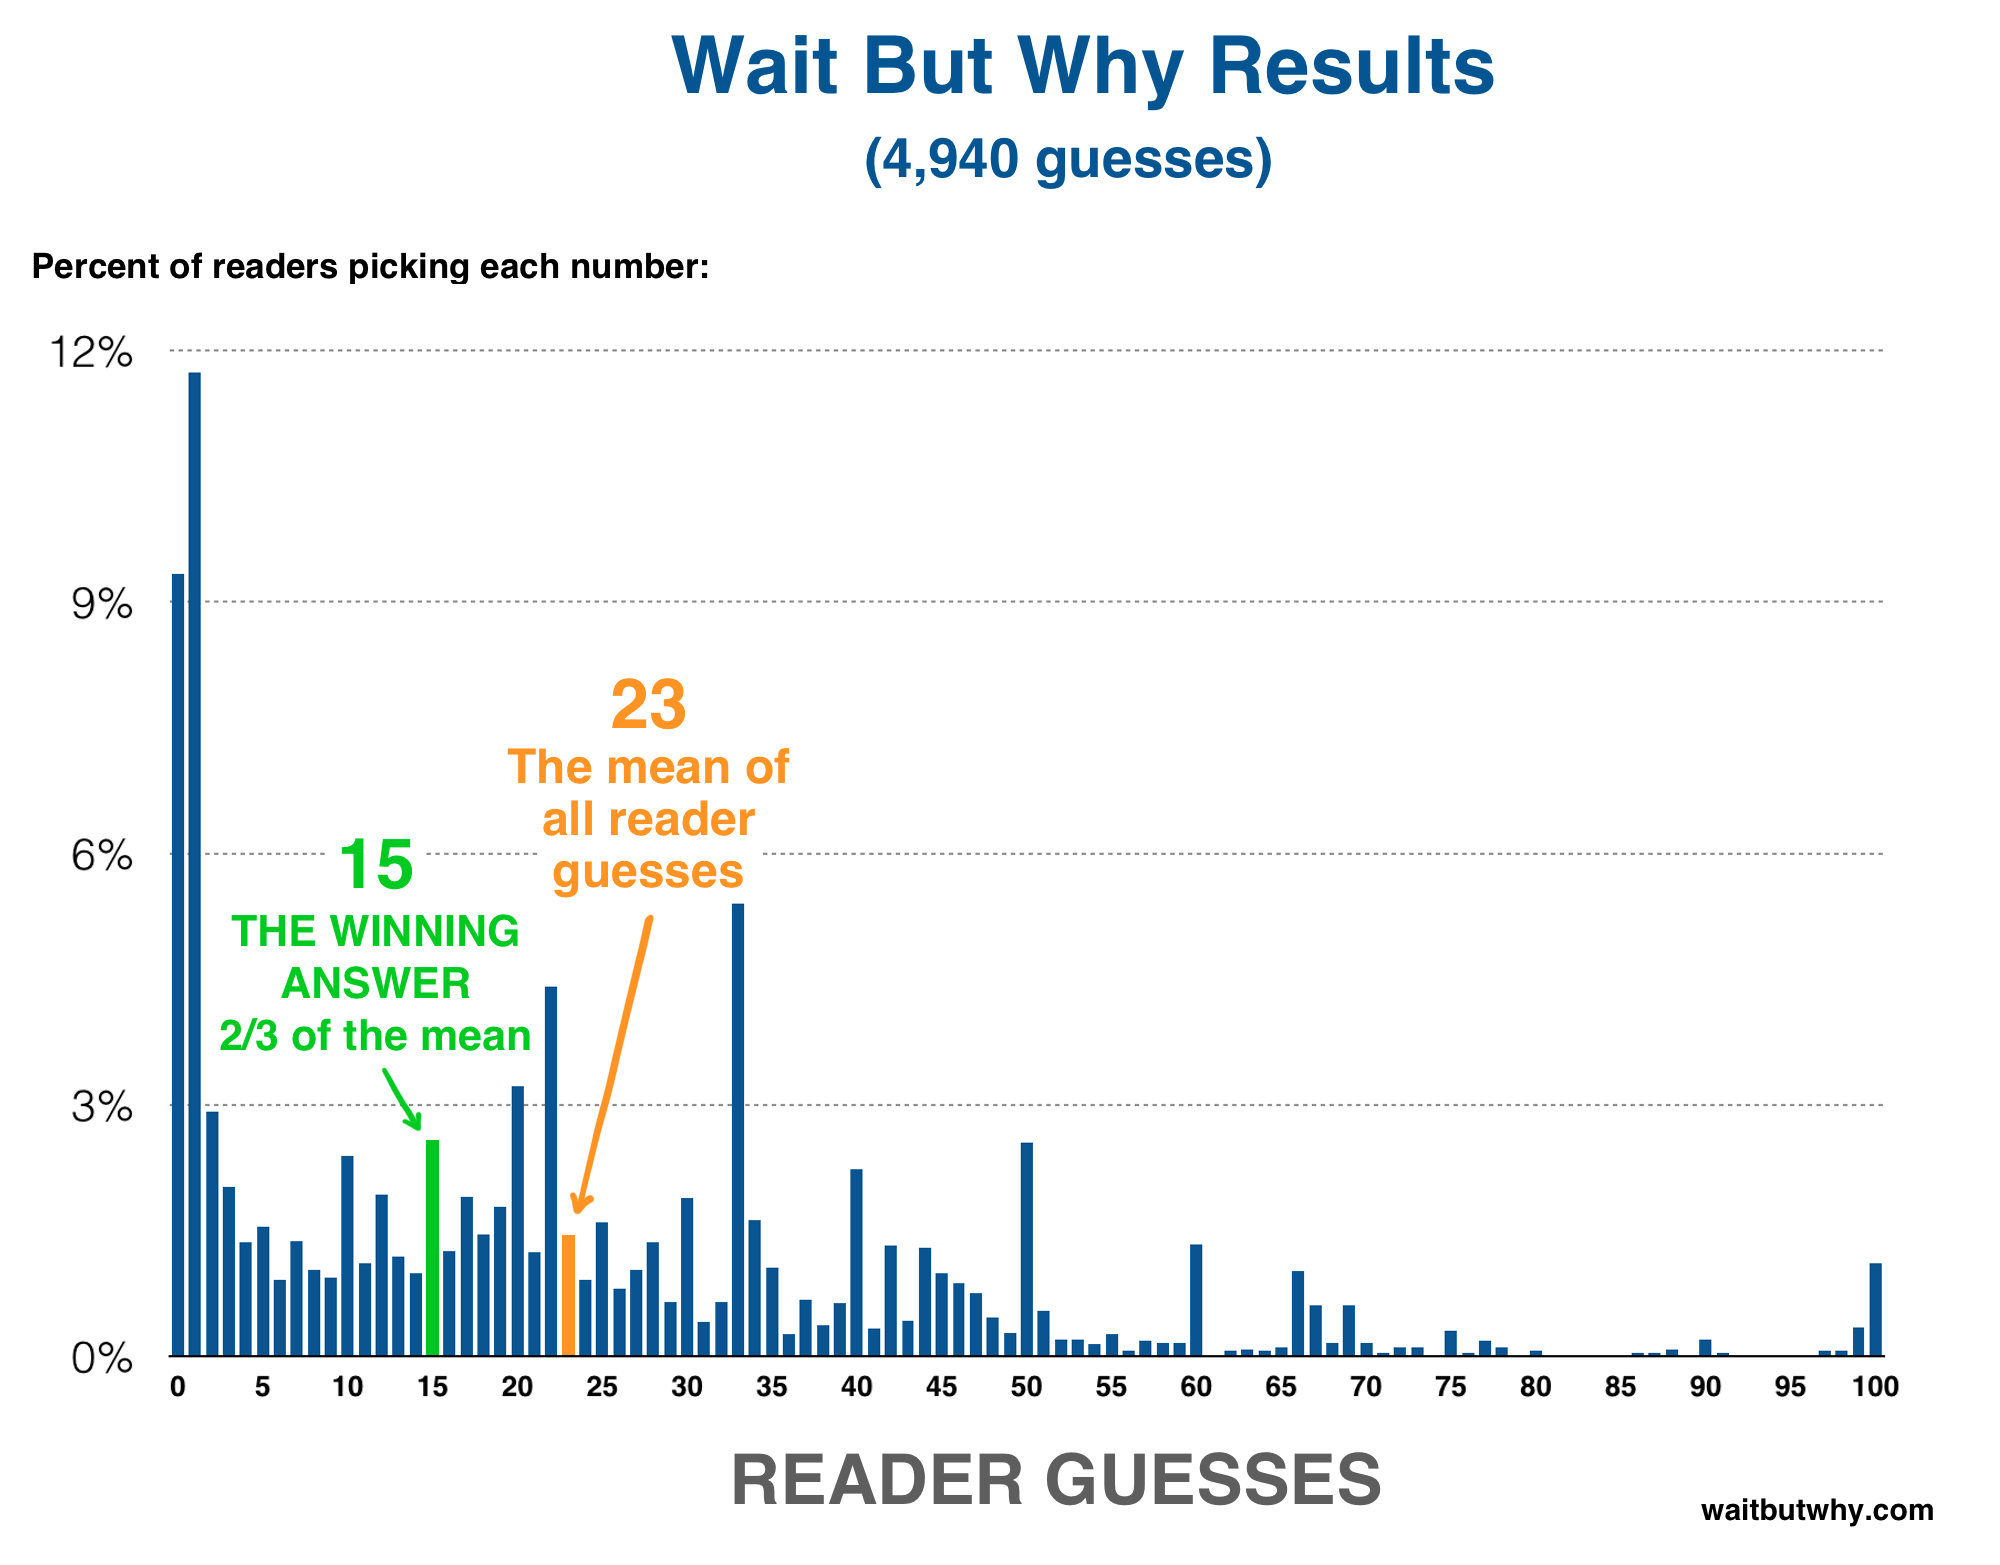
The mean is 22.956, making the winning answer 15. The fact that 15 is one of the numbers you’ll hit in the 50 > 33 > 22 > 15 > 10 > etc. chain is a coincidence, and because the final answer happened to fall on that chain, I suspect we have a higher number of winners than we would if the answer had ended up being 14 or 16.
In any case, congrats to the winners—I saw a number of people comment on last week’s post saying they picked 15.
Oh, and the New York Times? Here were their results:
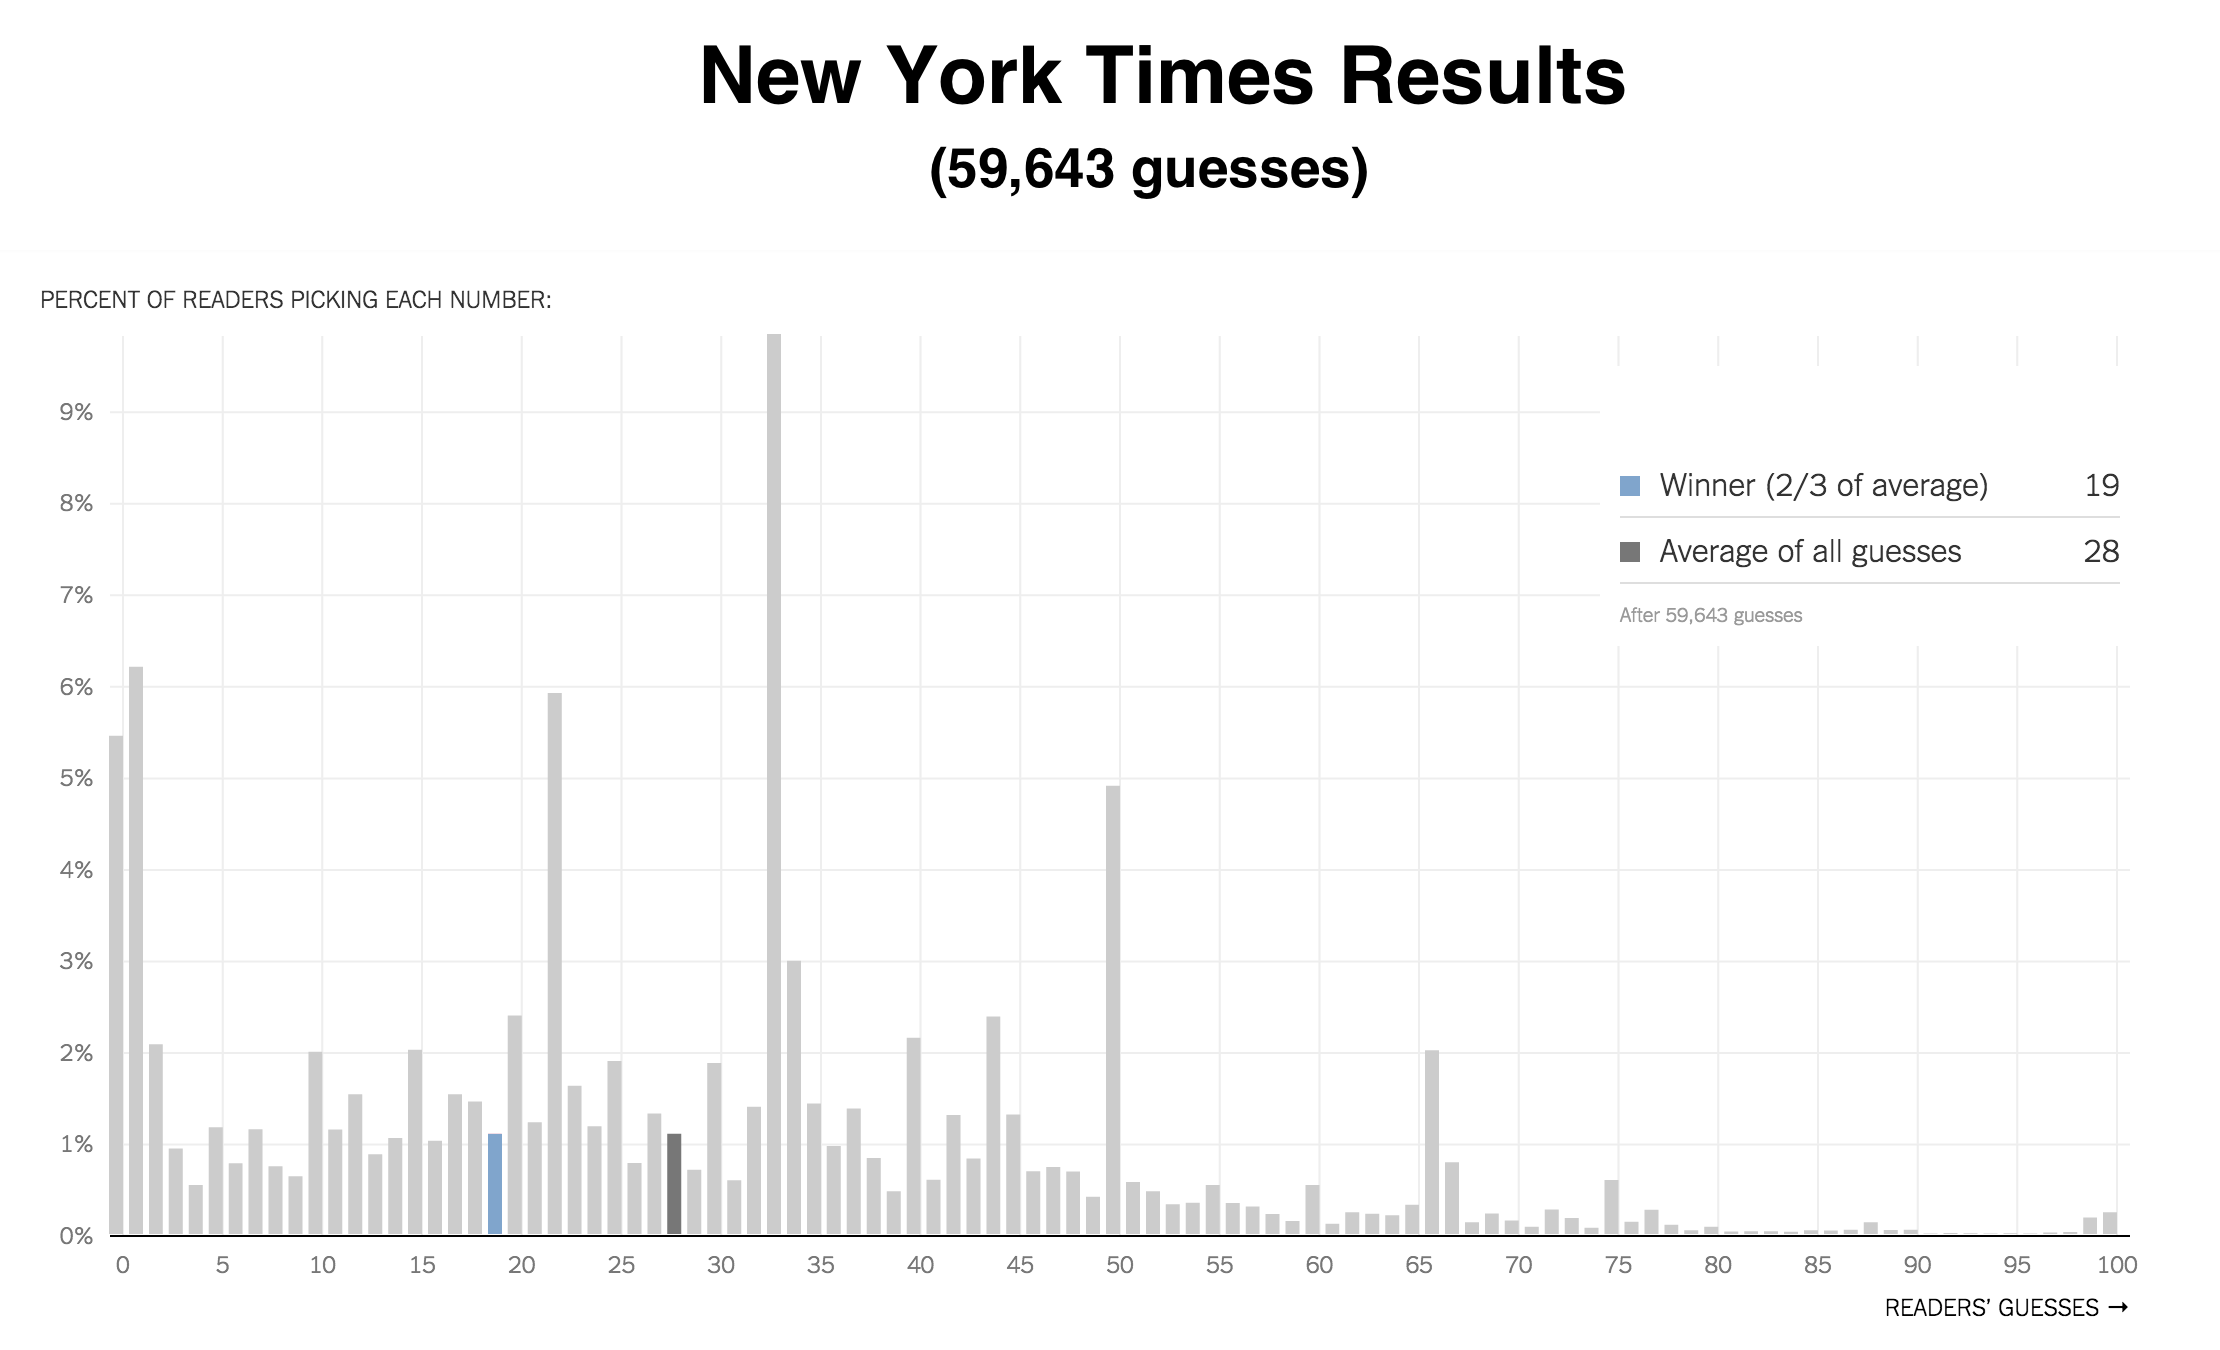
The two sets of results are very similar, with nearly identical shapes at most points. Two notable differences:
1) Wait But Why readers are less mature than New York Times readers, as evidenced by the higher 69 bar in the WBW graph.
2) Wait But Why readers thought a few steps farther about this, evidenced by the lower mean. Much of this comes from the larger percentage of WBW readers who thought through enough steps to get to 1 or 0. It’s also probably related to the fact that WBW readers think other WBW readers are smart, so those who guessed by trying to size up the crowd of guessers might have gone a bit lower in their guess here than they’d have gone when guessing on the NY Times. I’m one of those people—I guessed 17 when I saw this on the NY Times, and using the same logic, I guessed 13 here.
Finally, I’m leaving the submission form active, because why not, and for anyone who would like to look at the raw data, here’s the spreadsheet that the form results go into.
___________
You can sign up for the Dinner Table email list here to be notified about the new topic each week, and remember to submit future topic suggestions to [email protected].


